KTUtilsLibrary "KTUtils"
Utility functions for technical analysis indicators, trend detection, and volatility confirmation.
MGz(close, length)
MGz
@description Moving average smoother used for signal processing
Parameters:
close (float) : float Price input (typically close)
length (int) : int Length of smoothing period
Returns: float Smoothed value
atrConf(length)
atrConf
@description Calculates Average True Range (ATR) for volatility confirmation
Parameters:
length (simple int) : int Length for ATR calculation
Returns: float ATR value
f(input)
f
@description Simple Moving Average with fixed length
Parameters:
input (float) : float Input value
Returns: float Smoothed average
bcwSMA(s, l, m)
bcwSMA
@description Custom smoothing function with weight multiplier
Parameters:
s (float) : float Signal value
l (int) : int Length of smoothing
m (int) : int Weighting multiplier
Returns: float Smoothed output
MGxx(close, length)
MGxx
@description Custom Weighted Moving Average (WMA) variant
Parameters:
close (float) : float Price input
length (int) : int Period length
Returns: float MGxx smoothed output
_PerChange(lengthTime)
_PerChange
@description Measures percentage price change over a period and range deviation
Parameters:
lengthTime (int) : int Period for change measurement
Returns: tuple Measured change, high deviation, low deviation
dirmov(len)
dirmov
@description Calculates directional movement components
Parameters:
len (simple int) : int Lookback period
Returns: tuple Plus and Minus DI values
adx(dilen, adxlen)
adx
@description Calculates Average Directional Index (ADX)
Parameters:
dilen (simple int) : int Length for DI calculation
adxlen (simple int) : int Length for ADX smoothing
Returns: float ADX value
trChopAnalysis()
trChopAnalysis
@description Identifies chop and trend phases based on True Range Bollinger Bands
Returns: tuple TR SMA, chop state, trending state
wtiAnalysis(haclose, close, filterValue)
wtiAnalysis
@description Wave Trend Indicator (WTI) with signal crossover logic
Parameters:
haclose (float) : float Heikin-Ashi close
close (float) : float Standard close
filterValue (simple int) : int Smoothing length
Returns: tuple WTI lines and direction states
basicTrend(hahigh, halow, close, open, filterValue)
basicTrend
@description Determines trend direction based on HA high/low and close
Parameters:
hahigh (float) : float Heikin-Ashi high
halow (float) : float Heikin-Ashi low
close (float) : float Standard close
open (float) : float Standard open
filterValue (simple int) : int Smoothing period
Returns: tuple Uptrend, downtrend flags
metrics(close, filterValue)
metrics
@description Common market metrics
Parameters:
close (float) : float Price input
filterValue (int) : int RSI smoothing length
Returns: tuple VWMA, SMA10, RSI, smoothed RSI
piff(close, trend_change)
piff
@description Price-Informed Forward Forecasting (PIFF) model for trend strength
Parameters:
close (float) : float Price input
trend_change (float) : float Change in trend
Returns: tuple Percent change, flags for trend direction
getMACD()
getMACD
@description Returns MACD, signal line, and histogram
Returns: tuple MACD line, Signal line, Histogram
getStoch()
getStoch
@description Returns K and D lines of Stochastic Oscillator
Returns: tuple K and D lines
getKDJ()
getKDJ
@description KDJ momentum oscillator
Returns: tuple K, D, J, Average
getBBRatio()
getBBRatio
@description Bollinger Band Ratio (BBR) and signal flags
Returns: tuple Basis, Upper, Lower, BBR, BBR Up, BBR Down
getSupertrend()
getSupertrend
@description Supertrend values and direction flags
Returns: tuple Supertrend, Direction, Up, Down
Cerca negli script per "Heikin Ashi"
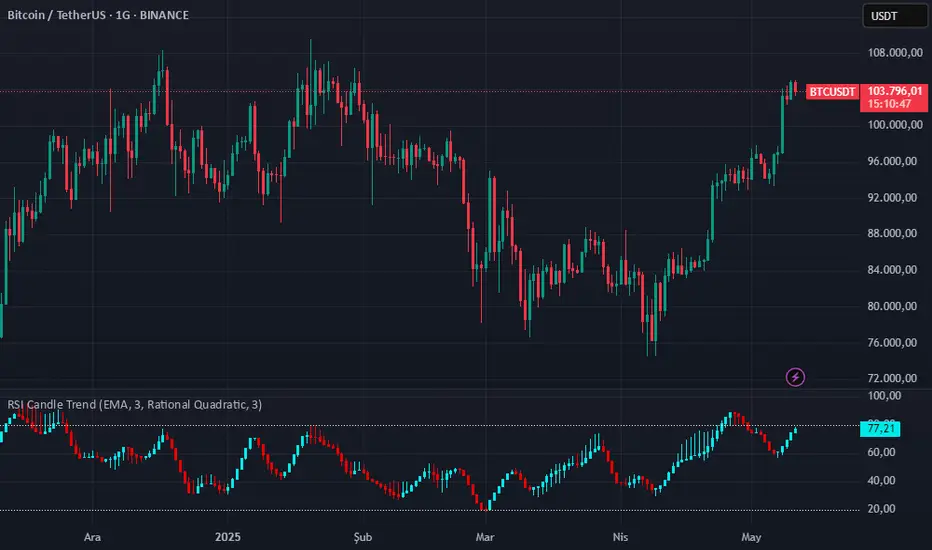
RSI Candle Trend🎯 Purpose:
This TradingView script is designed to visualize trend strength using RSI values as candle data, instead of traditional price candles. It transforms RSI data into custom candles using various smoothing and filtering methods (like Heikin-Ashi, Linear Regression, Rational Quadratic Filter, or McGinley Dynamic). It allows traders to:
📌Track RSI-based momentum using visual candle representation
📌Apply advanced smoothing/filters to the RSI to reduce noise
📌Highlight candle trend strength using dynamic coloring
📌Identify overbought/oversold zones using reference lines (RSI 80 and 20)
🧩 How It Works:
It calculates RSI values for open, high, low, close prices.
These RSI values are then optionally smoothed with user-selected moving averages (EMA, SMA, etc.).
Depending on the selected mode (Normal, Heikin-Ashi, Linear, Rational Quadratic), the RSI values are transformed into synthetic candles.
Candles are colored cyan (uptrend) or red (downtrend) based on RSI movement.
⚙️ Key Inputs:
Method: Type of moving average to smooth the RSI (e.g. EMA, SMA, VWMA, etc.)
Length: Length for RSI and smoothing filters
Candle: Type of candle transformation (Normal, Heikin-Ashi, Linear, Rational Quadratic)
Rational Quadratic: Parameter for the Rational Quadratic smoothing method
📊 Outputs:
Custom candles plotted using RSI-transformed values
Candle colors based on RSI strength:
Cyan for strong bullish RSI movement
Red for strong bearish RSI movement
Horizontal lines at RSI levels 80 and 20 (overbought/oversold)
🧠 Why Use This Indicator?
Unlike traditional RSI indicators that show a line, this tool:
Converts RSI into candle-style visualization
Helps traders visually interpret trend strength, reversals, or continuation patterns
Offers more refined control over RSI behavior and filtering
Provides a unique blend of momentum and candle analysis
❗Important Note:
This script is provided for educational purposes and does not constitute financial advice. Traders and investors should conduct their research and analysis before making any trading decisions.
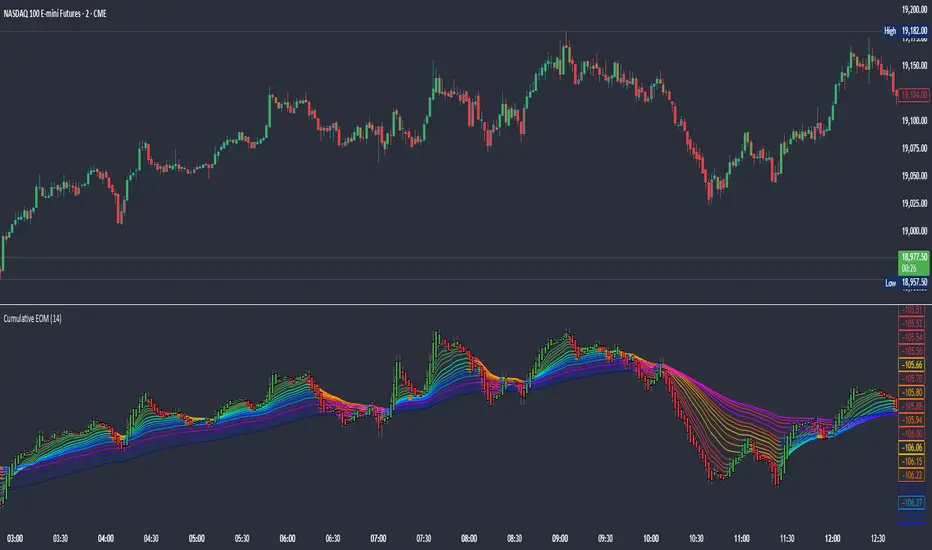
Cumulative Ease of MovementThis indicator visualizes Cumulative Ease of Movement (EOM) to assess the efficiency of price movement relative to volume and volatility. Instead of analysing individual bars, this tool accumulates EOM values over time, helping you identify persistent buying or selling pressure.
The original Ease of Movement created by Richard Arms is an oscillator:
EOM = ((Midpoint Move) / Box Ratio)
Midpoint Move = ((High + Low)/2) - ((High + Low )/2)
Box Ratio = Volume / (High - Low)
this indicator simply accumulates those values over time.
It incorporates a full Guppy Multiple Moving Average (GMMA) framework applied to the cumulative EOM curve, highlighting trend strength, transition zones, and slow/fast compression. Optional bar colouring and candle overlays reflect EOM direction and allow visual clarity during trending or congested conditions.
To facilitate the interpretation of the cumulative EOM, the GMMA and the Heikin Ashi smooths the signals, but the EOM itself is not smoothed.
Features
- Cumulative EOM plot (toggleable)
- GMMA overlays: short, medium, long-term
- Optional bar colouring based on EOM trend
- Heikin Ashi-style smoothing option
- EOM rendered as candle plot for momentum interpretation
Use Cases
- Identify trend strength and consistency through EOM slope + GMMA expansion
- Spot absorption and exhaustion zones when price pushes but cumulative EOM diverges
- Detect transitions when GMMA layers begin to compress and flip
- Validate breakout efficiency with strong EOM continuation
The Cumulative Ease of Movement (EOM) is designed to help traders follow the path of least resistance in the market by tracking whether price is moving efficiently with or against volume over time.
Rather than focusing on isolated bar-by-bar effort, it accumulates directional bias, allowing you to see whether buying or selling pressure is sustained and aligned with ease — or whether market moves are inefficient and likely to fade.
If you do not wish to use candles, or heikin ashi, you can enable the Cumulative EOM line and disable the candles.
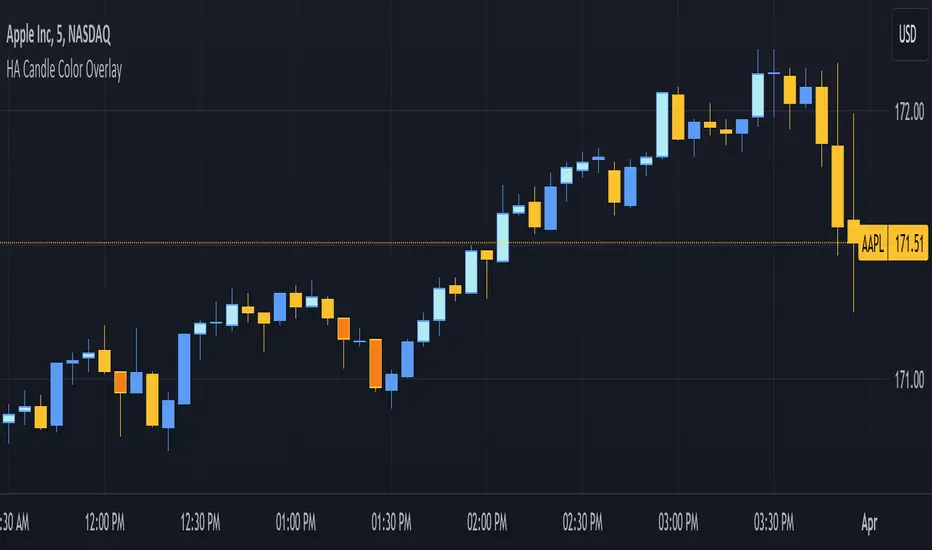
3. [Pufferman] - HA Candle Color OverlayThis indicator is designed for traders who utilize Heikin-Ashi (HA) candles to determine market trend direction and strength but prefer not to clutter their charts with multiple candlestick overlays or constantly switch between chart types. It aims to enhance chart readability by marking significant HA candles directly on the price chart, leveraging the unique characteristics of HA candles to signal trend direction and momentum.
Key Features:
1. Trend Identification through HA Candles: Automatically calculates Heikin-Ashi candles based on standard price data, highlighting significant HA candles that exhibit flat tops or bottoms. These characteristics are indicators of strong trend presence and direction. Highlights are in darker or lighter shade (darker - bearish or light - bullish colors) than the standard candles for easy read.
2. Cleaner Chart Presentation: Offers a streamlined alternative to overlaying HA candles on traditional candlestick charts or toggling between different chart views, keeping the user's interface uncluttered.
3. Selective Highlighting Based on Agreement: Marks traditional candles only when there's a concurrence between the HA candle's trend (bullish or bearish) and the traditional candle's trend. This feature ensures that only the most relevant signals are highlighted for the trader's attention.
Operational Mechanism: The script identifies HA candles with open equal to high (for flat tops) and open equal to low (for flat bottoms), which typically indicate strong trend movements. By marking these on the regular price chart, it provides immediate visual cues about trend strength and direction without needing to switch between HA and traditional candlestick views.
This tool is particularly useful for traders looking for a clean and efficient way to incorporate the insights of Heikin-Ashi candles into their technical analysis without the visual complexity of full HA candlestick overlays.
DCA StrategyIntroducing the DCA Strategy, a powerful tool for identifying long entry and exit opportunities in uptrending assets like cryptocurrencies, stocks, and gold. This strategy leverages the Heikin Ashi candlestick pattern and the RSI indicator to navigate potential price swings.
Core Functionality:
Buy Signal : A buy signal is generated when a bullish (green) Heikin Ashi candle appears after a bearish (red) one, indicating a potential reversal in a downtrend. Additionally, the RSI must be below a user-defined threshold (default: 85) to prevent buying overbought assets.
Sell Signal : The strategy exits the trade when the RSI surpasses the user-defined exit level (default: 85), suggesting the asset might be overbought.
Backtesting Flexibility : Users can customize the backtesting period by specifying the start and end years.
Key Advantages:
Trend-Following: Designed specifically for uptrending assets, aiming to capture profitable price movements.
Dynamic RSI Integration: The RSI indicator helps refine entry signals by avoiding overbought situations.
User-Defined Parameters: Allows customization of exit thresholds and backtesting periods to suit individual trading preferences.
Commission and Slippage: The script factors in realistic commission fees (0.1%) and slippage (2%) for a more accurate backtesting experience.
Beats Buy-and-Hold: Backtesting suggests this strategy outperforms a simple buy-and-hold approach in uptrending markets.
Overall, the DCA Strategy offers a valuable approach for traders seeking to capitalize on long opportunities in trending markets with the help of Heikin Ashi candles and RSI confirmation.
Cloud TrendCloud Trend Indicator ☁
The "Cloud Trend" indicator is a robust tool designed to identify and follow trends in financial markets. Leveraging Heikin Ashi principles, this indicator offers a clear visualization of trend strength and direction through the construction of a dual-line cloud.
How it works:
Principle of code is simple and efficient. Based on the loop, indicator calculates how many Heikin Ashi closes bars back are higher or lower of the current one and producing higherBars sum or lowerBars sum. In this way we have two lines from what clouds are constructed.
int higherBars = 0
int lowerBars = 0
// Heikin Ashi Close
series float h_close = math.avg(open,close,high,low)
// Calculation Lines
for i = 0 to lookbackInput - 1
if h_close < h_close
higherBars += 1
else if h_close > h_close
lowerBars += 1
Features:
Dual-Line Cloud Construction: The cloud is formed by two lines, where the upper line represents bullish momentum (aqua color) and the lower line reflects bearish momentum (red color).
Dynamic Bar Color: Traders can choose to color price bars based on trend strength. Aqua bars indicate a strong bullish trend, while red bars signify a robust bearish trend, providing valuable insights into market dynamics.
Customizable Lookback Period: Adapt the indicator to different market conditions by adjusting the lookback period. This flexibility accommodates various trading strategies and preferences.
Usage:
Cloud Color Signals: Changes in the cloud's color signal shifts in trend direction. Aqua signifies a bullish trend, while red indicates a bearish trend.
Bar Color Strength: If enabled, the color of price bars reflects the strength of the trend. Intense colors represent strong trends, offering a quick visual cue to the market's momentum.
Lookback Period Adjustment: Tailor the lookback period to match the timeframe and market conditions you are analyzing. Shorter periods capture immediate trends, while longer periods identify more sustained movements.
The "Cloud Trend" indicator, with its dual-line cloud construction, provides an intuitive way to interpret market trends. Whether you are a seasoned trader or a beginner, this tool enhances your technical analysis and supports more informed trading decisions.

Intrabar Analyzer [Kioseff Trading]Hello!
This indicator (Intrabar Analyzer) presents intrabar data in various derivative forms.
On-Chart Features
Traditional price data down to 1 min.
Heikin-Ashi price data down to 1 min.
Kagi price data down to 1 min.
Point & Figure price data down to 1 min.
Renko price data down to 1 min.
Linebreak price data down to 1 min.
LinReg channel
SMA
EMA
ALMA
Echomorphic Average (A @kaigouthro special!)
HMA
RMA
WMA
VWMA
VWAP
SWMA
SAR
Supertrend
On-Chart Features
Price x Volume graph
Intrabar technical rating
Positive volume index
Negative volume index
Price volume trend
RSI
%k
ROC
MFI
MFC
OBV
CCI
BBW
CMO
COG
KCW
MOM
RANGE
%r
Let's look at the objects populated by the indicator!
The image above shows what data correlates to the populated graphs!
Let's dial in on the price x volume graph.
The image above provides an example/explanation of the price x volume graph. All data is sourced from a lower timeframe (configurable - default = 1 minute).
Colors are configurable; the plot characters are configurable.
The numbers above show an alternative view of the price x volume graph!
Price graph
The price graph can populate 6 variations of price data: traditional, heikin-ashi, renko, point & figure, line break, and kagi.
The subsequent images will show all available forms of price data, in addition to a randomly selected, on-chart technical indicator!
Kagi + LinReg
Traditional + EMA
Renko + SAR
Point & Figure + ALMA
Heikin-Ashi + Supertrend
Line Break + VWAP
You can display up to three indicators concomitantly - all calculated using intrabar data!
Lastly, the indicator displays the TradingView calculated technical rating for the intrabar.
The technical ratings are multiplied by x100 and oriented left & right of the price box. Left values are negative; right values are positive. The "0" value is not shown; therefore, if the technical rating isn't highlighted then the rating is "0".
The image above shows the technical rating system in action (:
That's it!
This was a fun project and I'm certainly willing to add more - let me know if there's anything you'd like included.
Additionally, a future feature involves compatibility with any custom indicator! Stay tuned; thank you for checking this out (:
Thank you to @kaigouthro, TradingView and @PineCoders for providing some cool libraries to play with!

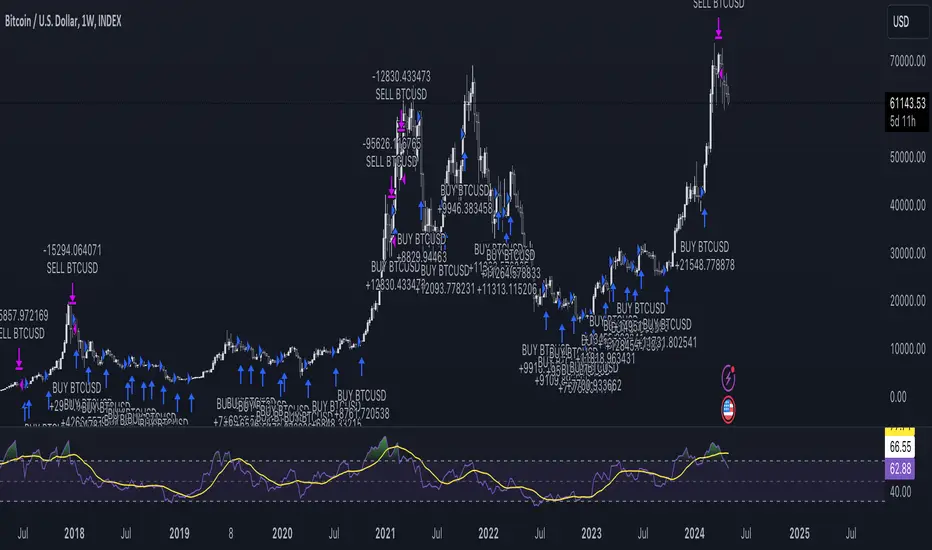
Cipher Twister - Long and ShortINTRO / NOTES:
This script is based on Market Cipher B Oscillator by Falcon
The difference in this script is that only the useful points are printed on the indicator, namely Long and Short Trade Execution signals to be used by a bot, namely the PT Bot.
The script also differs from the original that it has been upgraded to Pinescript v4
This oscillator can be used with ALL time frames, but generally works the best on 15 minute and 1 hour charts on ANY market, no matter, stock, forex, crypto, spot, futures, derivatives, Nasdaq etc...
DEFINITIONS:
This oscillator forms the foundation of Buy and Exit of Long and Short Trades.
There are 2 'Red' Lines at the top of the channel and 2 Green Lines at the bottom of the channel.
These two channels are set at default to be +53 / -53 and +60 / -60 respectively. These two lines will serve as the threshold point if one is to make cautious trades only.
There is a center line which divides the Oscillator into two parts. Above the center line, the market is in over bought territory and Below the center line is in over sold territory.
'Red' dots are drawn by the indicator to represent a potential Short (or a signal to exit from a Long position)
'Green' dots are drawn by the indicator to represent a potential Long (or a signal to exit from a Short position)
The 'Red' and 'Green' dots are draw when a Cross between both wt1 & wt2 cross, thus providing a fantastic indication of potential trend reversal and entry/exit of a position.
STRATEGY NOTES:
The strategy to use this indicator with for realistic and proper results would be to use it with an automated Trading Bot such as Profit Trailer (PT-BOT)
You could use this strategy manually, however it would mean you would need to sit in front of the screen all day and night long and activate the trades immediately after the 'red'/'green' dots are drawn. Usually this will result in non-optimal entries and exits as well as loss on various instances when a 'red' and 'green' dot are printed close together (which is usually when the market goes into correction/consolidation) and slow entries/exits will result in a loss rather than a small profit or exit at BE (Break Even)
ACTUAL STRATEGY (For use with automated bot)
To be used in conjunction with Heikin Ashi Candles for added cautionary measures
For LONGs ONLY
--------------------
1/ When 'Green' dot is drawn, ACTIVATE Long Position
(Use 1.5% Risk Management for each trade)
(Use Lot size based on 1.5% risk management and xLeverage (if any))
2/ Make sure bot Opens an SL (Stop Loss) value based on 1.5% Risk Management
3/ When 'Red' dot is drawn, CLOSE Long Position.
*If you want to add extra caution to your trade, only activate the trade if the 'Green' dot is BELOW the 'Green' Markers
*For added caution, use color coded Heikin Ashi candles to 'confirm' Activation and Closing of a trade in the bot configuration
---------------------------------------------------------------------------------------------------
For SHORTs ONLY
--------------------
1/ When 'Red' dot is drawn, ACTIVATE Short Position
(Use 1.5% Risk Management for each trade)
(Use Lot size based on 1.5% risk management and xLeverage (if any))
2/ Make sure bot Opens an SL (Stop Loss) value based on 1.5% Risk Management
3/ When 'Green' dot is drawn, CLOSE Short Position
*If you want to add extra caution to your trade, only activate the trade if the 'Red' dot is Above the Red Markers
*For added caution, use color coded Heikin Ashi candles to 'confirm' Activation and Closing of a trade in the bot configuration
---------------------------------------------------------------------------------------------------
Supplementary Notes:
Make sure that your bot configuration will only activate ONE TRADE when the 'Green'/'Red' dot appears.
Occasionally during high volatility , 'red'/'green' dots will appear intermittently before remaining drawn, thus the oscillator 'redraws' the dots during market movement.
There will be times where occasionally a 'green' dot or a 'red' dot will appear, the trade will be opened, but the trade will fail due to the market manipulation (algorithm/market maker bots/fake volume etc), to wipe out those trading on derivatives and futures markets using leverage. Do not worry about this, no bot can make 100% wins, no strategy will achieve 100% win ratio and one necessarily doesn't need a high win ratio when using strict money management practices with your trading for SL and lot size.
If you use this method, you will see great results, but again I must stress, using this method with a fully automated bot is the only way to achieve proper results.

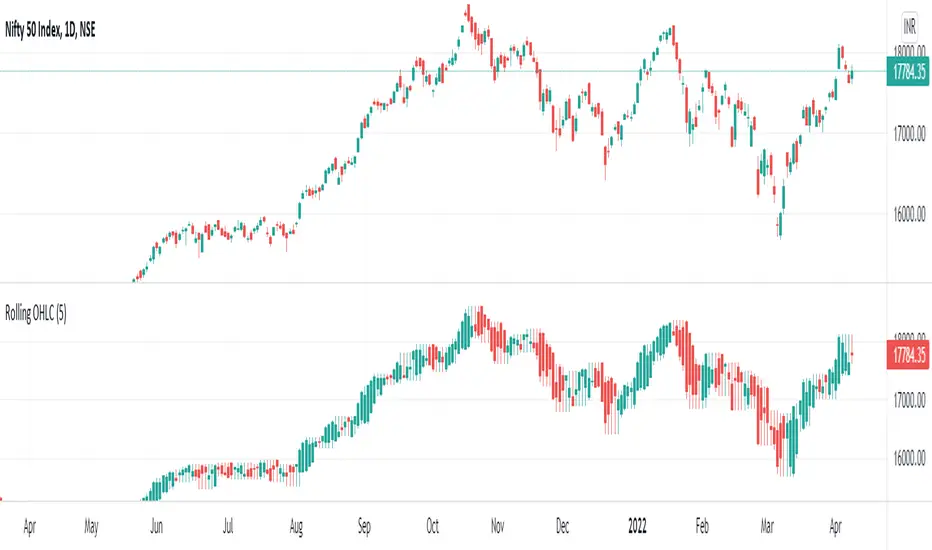
Rolling OHLC Candles█ OVERVIEW
This indicator displays a Rolling OHLC Bars for a given timeframe Multiplier. Contrary to OHLC Charts, if the timeframe Multiplier is "5", this indicator plot OHLC of the last 5 Candles.
█ WHAT IS THE NEED FOR IT
Let's see if we want to use a Higher timeframe OHLC Data using security function or resolution options. The indicator repaints until the higher timeframe OHLC Candle closes, leading to a repainting strategy or indicator using higher-timeframe data. So we can use Rolling OHLC Candles in these cases.
█ USES
To Pull out higher timeframe OHLC Data to build a non-repainting strategy or indicator.
Prominently, traders use Heikin Ashi Candles to locate trends or trading opportunities easier than traditional candlesticks. But the OHLC in those Heikin Ashi candles doesn't match with conventional candlesticks. We can use these Rolling OHLC Candles as an alternative for Heikin Ashi Candles because Here we can locate trends or trading opportunities easier than traditional candlesticks, and also close of these candles matches the close of the standard candlesticks, which can help us to take trades based on the close of the candles.
█ WHY I AM BUILDING THIS SIMPLE INDICATOR
There is no doubt higher timeframe analysis is a critical study to mastering the markets.
I found a necessity for an indicator that analyses multiple higher timeframes and gives us a cumulative or average trend direction. I already built the indicator; I will release it soon. The Indicator I am building is wholly based on my understanding and perspective of Market Structure. Please use this indicator idea to remove the repainting issue when you make an indicator that utilises higher timeframe data.
I am using this in my upcoming indicators. Felt to share before head.
Stay Tuned...
If you have any recommendations or alternative ideas, then please drop a comment under the script ;)
lib_Indicators_v2_DTULibrary "lib_Indicators_v2_DTU"
This library functions returns included Moving averages, indicators with factorization, functions candles, function heikinashi and more.
Created it to feed as backend of my indicator/strategy "Indicators & Combinations Framework Advanced v2 " that will be released ASAP.
This is replacement of my previous indicator (lib_indicators_DT)
I will add an indicator example which will use this indicator named as "lib_indicators_v2_DTU example" to help the usage of this library
Additionally library will be updated with more indicators in the future
NOTES:
Indicator functions returns only one series :-(
plotcandle function returns candle series
INDICATOR LIST:
hide = 'DONT DISPLAY', //Dont display & calculate the indicator. (For my framework usage)
alma = 'alma(src,len,offset=0.85,sigma=6)', //Arnaud Legoux Moving Average
ama = 'ama(src,len,fast=14,slow=100)', //Adjusted Moving Average
acdst = 'accdist()', //Accumulation/distribution index.
cma = 'cma(src,len)', //Corrective Moving average
dema = 'dema(src,len)', //Double EMA (Same as EMA with 2 factor)
ema = 'ema(src,len)', //Exponential Moving Average
gmma = 'gmma(src,len)', //Geometric Mean Moving Average
hghst = 'highest(src,len)', //Highest value for a given number of bars back.
hl2ma = 'hl2ma(src,len)', //higest lowest moving average
hma = 'hma(src,len)', //Hull Moving Average.
lgAdt = 'lagAdapt(src,len,perclen=5,fperc=50)', //Ehler's Adaptive Laguerre filter
lgAdV = 'lagAdaptV(src,len,perclen=5,fperc=50)', //Ehler's Adaptive Laguerre filter variation
lguer = 'laguerre(src,len)', //Ehler's Laguerre filter
lsrcp = 'lesrcp(src,len)', //lowest exponential esrcpanding moving line
lexp = 'lexp(src,len)', //lowest exponential expanding moving line
linrg = 'linreg(src,len,loffset=1)', //Linear regression
lowst = 'lowest(src,len)', //Lovest value for a given number of bars back.
pcnl = 'percntl(src,len)', //percentile nearest rank. Calculates percentile using method of Nearest Rank.
pcnli = 'percntli(src,len)', //percentile linear interpolation. Calculates percentile using method of linear interpolation between the two nearest ranks.
rema = 'rema(src,len)', //Range EMA (REMA)
rma = 'rma(src,len)', //Moving average used in RSI. It is the exponentially weighted moving average with alpha = 1 / length.
sma = 'sma(src,len)', //Smoothed Moving Average
smma = 'smma(src,len)', //Smoothed Moving Average
supr2 = 'super2(src,len)', //Ehler's super smoother, 2 pole
supr3 = 'super3(src,len)', //Ehler's super smoother, 3 pole
strnd = 'supertrend(src,len,period=3)', //Supertrend indicator
swma = 'swma(src,len)', //Sine-Weighted Moving Average
tema = 'tema(src,len)', //Triple EMA (Same as EMA with 3 factor)
tma = 'tma(src,len)', //Triangular Moving Average
vida = 'vida(src,len)', //Variable Index Dynamic Average
vwma = 'vwma(src,len)', //Volume Weigted Moving Average
wma = 'wma(src,len)', //Weigted Moving Average
angle = 'angle(src,len)', //angle of the series (Use its Input as another indicator output)
atr = 'atr(src,len)', //average true range. RMA of true range.
bbr = 'bbr(src,len,mult=1)', //bollinger %%
bbw = 'bbw(src,len,mult=2)', //Bollinger Bands Width. The Bollinger Band Width is the difference between the upper and the lower Bollinger Bands divided by the middle band.
cci = 'cci(src,len)', //commodity channel index
cctbb = 'cctbbo(src,len)', //CCT Bollinger Band Oscilator
chng = 'change(src,len)', //Difference between current value and previous, source - source .
cmo = 'cmo(src,len)', //Chande Momentum Oscillator. Calculates the difference between the sum of recent gains and the sum of recent losses and then divides the result by the sum of all price movement over the same period.
cog = 'cog(src,len)', //The cog (center of gravity) is an indicator based on statistics and the Fibonacci golden ratio.
cpcrv = 'copcurve(src,len)', //Coppock Curve. was originally developed by Edwin "Sedge" Coppock (Barron's Magazine, October 1962).
corrl = 'correl(src,len)', //Correlation coefficient. Describes the degree to which two series tend to deviate from their ta.sma values.
count = 'count(src,len)', //green avg - red avg
dev = 'dev(src,len)', //ta.dev() Measure of difference between the series and it's ta.sma
fall = 'falling(src,len)', //ta.falling() Test if the `source` series is now falling for `length` bars long. (Use its Input as another indicator output)
kcr = 'kcr(src,len,mult=2)', //Keltner Channels Range
kcw = 'kcw(src,len,mult=2)', //ta.kcw(). Keltner Channels Width. The Keltner Channels Width is the difference between the upper and the lower Keltner Channels divided by the middle channel.
macd = 'macd(src,len)', //macd
mfi = 'mfi(src,len)', //Money Flow Index
nvi = 'nvi()', //Negative Volume Index
obv = 'obv()', //On Balance Volume
pvi = 'pvi()', //Positive Volume Index
pvt = 'pvt()', //Price Volume Trend
rise = 'rising(src,len)', //ta.rising() Test if the `source` series is now rising for `length` bars long. (Use its Input as another indicator output)
roc = 'roc(src,len)', //Rate of Change
rsi = 'rsi(src,len)', //Relative strength Index
smosc = 'smi_osc(src,len,fast=5, slow=34)', //smi Oscillator
smsig = 'smi_sig(src,len,fast=5, slow=34)', //smi Signal
stdev = 'stdev(src,len)', //Standart deviation
trix = 'trix(src,len)' , //the rate of change of a triple exponentially smoothed moving average.
tsi = 'tsi(src,len)', //True Strength Index
vari = 'variance(src,len)', //ta.variance(). Variance is the expectation of the squared deviation of a series from its mean (ta.sma), and it informally measures how far a set of numbers are spread out from their mean.
wilpc = 'willprc(src,len)', //Williams %R
wad = 'wad()', //Williams Accumulation/Distribution.
wvad = 'wvad()' //Williams Variable Accumulation/Distribution.
}
f_func(string, float, simple, float, float, float, simple) f_func Return selected indicator value with different parameters. New version. Use extra parameters for available indicators
Parameters:
string : FuncType_ indicator from the indicator list
float : src_ close, open, high, low,hl2, hlc3, ohlc4 or any
simple : int length_ indicator length
float : p1 extra parameter-1. active on Version 2 for defining multi arguments indicator input value. ex: lagAdapt(src_, length_,LAPercLen_=p1,FPerc_=p2)
float : p2 extra parameter-2. active on Version 2 for defining multi arguments indicator input value. ex: lagAdapt(src_, length_,LAPercLen_=p1,FPerc_=p2)
float : p3 extra parameter-3. active on Version 2 for defining multi arguments indicator input value. ex: lagAdapt(src_, length_,LAPercLen_=p1,FPerc_=p2)
simple : int version_ indicator version for backward compatibility. V1:dont use extra parameters p1,p2,p3 and use default values. V2: use extra parameters for available indicators
Returns: float Return calculated indicator value
fn_heikin(float, float, float, float) fn_heikin Return given src data (open, high,low,close) as heikin ashi candle values
Parameters:
float : o_ open value
float : h_ high value
float : l_ low value
float : c_ close value
Returns: float heikin ashi open, high,low,close vlues that will be used with plotcandle
fn_plotFunction(float, string, simple, bool) fn_plotFunction Return input src data with different plotting options
Parameters:
float : src_ indicator src_data or any other series.....
string : plotingType Ploting type of the function on the screen
simple : int stochlen_ length for plotingType for stochastic and PercentRank options
bool : plotSWMA Use SWMA for smoothing Ploting
Returns: float
fn_funcPlotV2(string, float, simple, float, float, float, simple, string, simple, bool, bool) fn_funcPlotV2 Return selected indicator value with different parameters. New version. Use extra parameters fora available indicators
Parameters:
string : FuncType_ indicator from the indicator list
float : src_data_ close, open, high, low,hl2, hlc3, ohlc4 or any
simple : int length_ indicator length
float : p1 extra parameter-1. active on Version 2 for defining multi arguments indicator input value. ex: lagAdapt(src_, length_,LAPercLen_=p1,FPerc_=p2)
float : p2 extra parameter-2. active on Version 2 for defining multi arguments indicator input value. ex: lagAdapt(src_, length_,LAPercLen_=p1,FPerc_=p2)
float : p3 extra parameter-3. active on Version 2 for defining multi arguments indicator input value. ex: lagAdapt(src_, length_,LAPercLen_=p1,FPerc_=p2)
simple : int version_ indicator version for backward compatibility. V1:dont use extra parameters p1,p2,p3 and use default values. V2: use extra parameters for available indicators
string : plotingType Ploting type of the function on the screen
simple : int stochlen_ length for plotingType for stochastic and PercentRank options
bool : plotSWMA Use SWMA for smoothing Ploting
bool : log_ Use log on function entries
Returns: float Return calculated indicator value
fn_factor(string, float, simple, float, float, float, simple, simple, string, simple, bool, bool) fn_factor Return selected indicator's factorization with given arguments
Parameters:
string : FuncType_ indicator from the indicator list
float : src_data_ close, open, high, low,hl2, hlc3, ohlc4 or any
simple : int length_ indicator length
float : p1 parameter-1. active on Version 2 for defining multi arguments indicator input value. ex: lagAdapt(src_, length_,LAPercLen_=p1,FPerc_=p2)
float : p2 parameter-2. active on Version 2 for defining multi arguments indicator input value. ex: lagAdapt(src_, length_,LAPercLen_=p1,FPerc_=p2)
float : p3 parameter-3. active on Version 2 for defining multi arguments indicator input value. ex: lagAdapt(src_, length_,LAPercLen_=p1,FPerc_=p2)
simple : int version_ indicator version for backward compatibility. V1:dont use extra parameters p1,p2,p3 and use default values. V2: use extra parameters for available indicators
simple : int fact_ Add double triple, Quatr factor to selected indicator (like converting EMA to 2-DEMA, 3-TEMA, 4-QEMA...)
string : plotingType Ploting type of the function on the screen
simple : int stochlen_ length for plotingType for stochastic and PercentRank options
bool : plotSWMA Use SWMA for smoothing Ploting
bool : log_ Use log on function entries
Returns: float Return result of the function
fn_plotCandles(string, simple, float, float, float, simple, string, simple, bool, bool, bool) fn_plotCandles Return selected indicator's candle values with different parameters also heikinashi is available
Parameters:
string : FuncType_ indicator from the indicator list
simple : int length_ indicator length
float : p1 parameter-1. active on Version 2 for defining multi arguments indicator input value. ex: lagAdapt(src_, length_,LAPercLen_=p1,FPerc_=p2)
float : p2 parameter-2. active on Version 2 for defining multi arguments indicator input value. ex: lagAdapt(src_, length_,LAPercLen_=p1,FPerc_=p2)
float : p3 parameter-3. active on Version 2 for defining multi arguments indicator input value. ex: lagAdapt(src_, length_,LAPercLen_=p1,FPerc_=p2)
simple : int version_ indicator version for backward compatibility. V1:dont use extra parameters p1,p2,p3 and use default values. V2: use extra parameters for available indicators
string : plotingType Ploting type of the function on the screen
simple : int stochlen_ length for plotingType for stochastic and PercentRank options
bool : plotSWMA Use SWMA for smoothing Ploting
bool : log_ Use log on function entries
bool : plotheikin_ Use Heikin Ashi on Plot
Returns: float

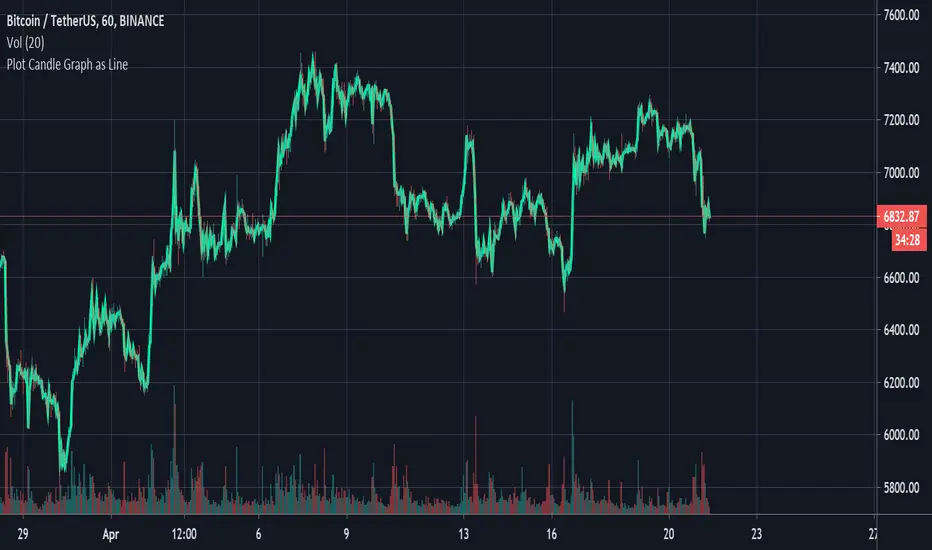
Plot Standard Candlesticks as LineThis script is to be used with Heikin Ashi or any alternative candlesticks.
It is used to show the actual price movement, (As a line), alongside the alternative candlestick's movement.
The script can be used to help read the signals sent out by the alternative candlesticks. For example, the script can be used to plot the actual price movement, (as a line), alongside Heikin Ashi to easily see how the price reacts to the Heikin Ashi Signals.
[STRATEGY] MA Cross ElevenThis script is a crossing of eleven different MA, with alerts and SL and TP.
The simplest is what works best...
SMA --> Simple
EMA --> Exponential
WMA --> Weighted
VWMA --> Volume Weighted
SMMA --> Smoothed
DEMA --> Double Exponential
TEMA --> Triple Exponential
HMA --> Hull
TMA --> Triangular
SSMA --> SuperSmoother filter
ZEMA --> Zero Lag Exponential
Using "once per bar close" repaint is 0%, but if you like risk can choose "once per bar", better profit.
Thanks to JustUncleL and his amazing sripts.
Enjoy!
www.tradingview.com
"Note: When using non-standard (Renko, Kagi, Line Break, Point and Figure, Heikin Ashi, Spread Charts) types of chart as a basis for strategy, you need to realize that the result will be different. The orders will be executed at the prices of this chart (e.g.for Heikin Ashi it’ll take Heikin Ashi prices (the average ones) not the real market prices). Therefore we highly recommend you to use standard chart type for strategies."

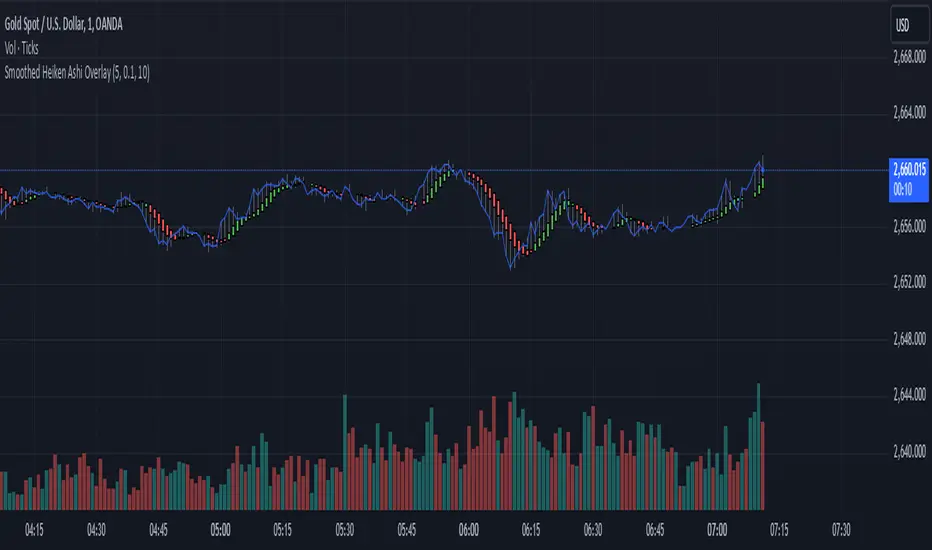
Smoothed Heiken Ashi Trend FilterThis indicator applies the Heiken Ashi technique with added smoothing and trend filtering to help reduce noise and improve trend detection.
Components of the Indicator:
Heiken Ashi Calculations:
Heiken Ashi Close (ha_close): This is the smoothed average of the current bar’s open, high, low, and close prices, calculated with a simple moving average (SMA) to filter out noise.
Heiken Ashi Open (ha_open): This is the average of the previous Heiken Ashi Open and the current Heiken Ashi Close. It’s also initialized to smooth the transition on the first bar.
Heiken Ashi High (ha_high) and Low (ha_low): These values are calculated as the highest and lowest values among the high, Heiken Ashi Open, and Heiken Ashi Close for each bar.
Smoothing and Noise Reduction:
Smoothing Length: The indicator applies a smoothing length to the Heiken Ashi Close, calculated with an SMA. This reduces minor fluctuations, giving a clearer view of the price action.
Minimum Body Size Filter: This filter calculates the body size of each Heiken Ashi candle and compares it to a percentage of the Average True Range (ATR). Only significant candles (those with larger bodies) are plotted, reducing weak or indecisive signals.
Trend Filtering with Moving Average:
The indicator uses a simple moving average (SMA) as a trend filter. By comparing the Heiken Ashi Close to the moving average:
Bullish Trend: The Heiken Ashi candle is green when it’s above the moving average.
Bearish Trend: The Heiken Ashi candle is red when it’s below the moving average.
How to Use This Indicator:
Trend Identification:
Green candles signify a bullish trend, while red candles signify a bearish trend.
The smoothing and trend filtering make it easier to identify sustained trends and avoid reacting to short-term fluctuations.
Filtering Out Noise:
Minor price fluctuations and small-bodied candles (often resulting in indecisive signals) are filtered out, leaving only significant signals.
Adjustable Parameters:
Smoothing Length: Controls the degree of smoothing applied to the Heiken Ashi Close value. Increasing this value will make the Heiken Ashi candles smoother.
Minimum Body Size: This is a percentage of the ATR, used to filter out small or indecisive candles.
Trend Moving Average Length: Controls the period of the moving average used as a trend filter.
This Smoothed Heiken Ashi Trend Filter indicator is useful for identifying trends and filtering out noisy signals. By smoothing and filtering, it helps traders focus on the overall trend rather than minor price movements.
Let me know if there’s anything more you’d like to add or adjust!
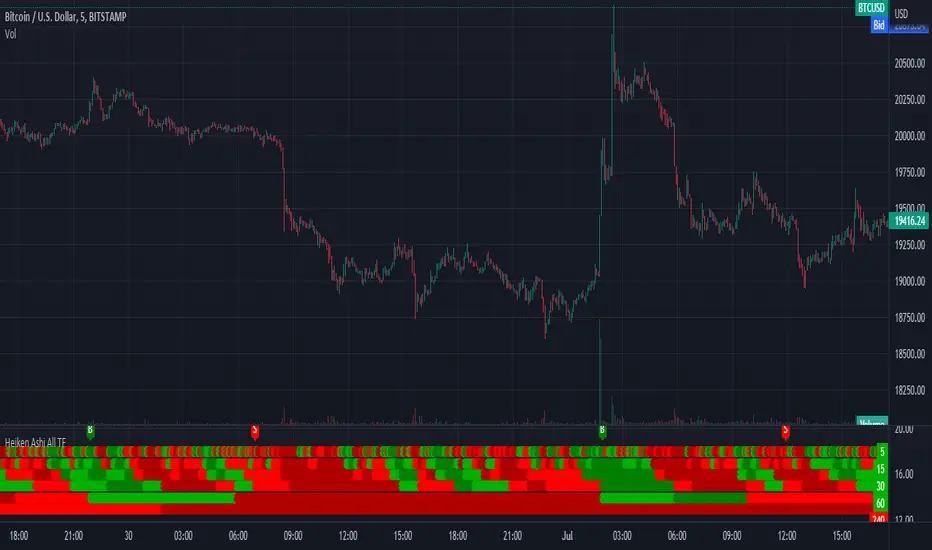
Heiken Ashi All TFI have always fighted to understand the market direction because it looks different on different timeframes.
I wanted an indicator where I can see all the different timeframes at once.
This indicator shows the Heiken Ashi candle colors for different time frames at once.
Use it on the 5 Minute timeframe.
4 colors:
dark green: bullis green HA candle with no low shadow.
green: green HA candle.
red: red HA candle
datk red: bearish red HA candle with non existing upper shadow.
the timeframes are by default:
5m 15m 30m 1H 4H 1D
can be adjusted if needed.
signals:
in the top line the Buy / Shell Signals are shown when the selected timeframes are all changed.
for example after a buy signal a sell signal will be printend when all the selected timeframes are turned into red or dark red.
Do not use it as a tranding signal, us it for confirmation.
It doesn't predict. it shows the market's current state.
Don't forget that the latest candles are based on the current value. The higher timeframe candle color depends on the current price.
If the higher timeframe close price so different that the HA candle color changes it reprins for all the affected 5m dots.
loxxexpandedsourcetypesLibrary "loxxexpandedsourcetypes"
Expanded source types used in Loxx's indicators and strategies.
rclose()
rClose: regular close
Returns: float
ropen()
rClose: regular open
Returns: float
rhigh()
rClose: regular high
Returns: float
rlow()
rClose: regular low
Returns: float
rmedian()
rClose: regular hl2
Returns: float
rtypical()
rClose: regular hlc3
Returns: float
rweighted()
rClose: regular hlcc4
Returns: float
raverage()
rClose: regular ohlc4
Returns: float
ravemedbody()
rClose: median body
Returns: float
rtrendb()
rClose: trend regular
Returns: float
rtrendbext()
rClose: trend extreme
Returns: float
haclose(haclose)
haclose: heiken-ashi close
Parameters:
haclose : float
Returns: float
haopen(haopen)
haopen: heiken-ashi open
Parameters:
haopen : float
Returns: float
hahigh(hahigh)
hahigh: heiken-ashi high
Parameters:
hahigh : float
Returns: float
halow(halow)
halow: heiken-ashi low
Parameters:
halow : float
Returns: float
hamedian(hamedian)
hamedian: heiken-ashi median
Parameters:
hamedian : float
Returns: float
hatypical(hatypical)
hatypical: heiken-ashi typical
Parameters:
hatypical : float
Returns: float
haweighted(haweighted)
haweighted: heiken-ashi weighted
Parameters:
haweighted : float
Returns: float
haaverage(haweighted)
haaverage: heiken-ashi average
Parameters:
haweighted : float
Returns: float
haavemedbody(haclose, haopen)
haavemedbody: heiken-ashi median body
Parameters:
haclose : float
haopen : float
Returns: float
hatrendb(haclose, haopen, hahigh, halow)
hatrendb: heiken-ashi trend
Parameters:
haclose : float
haopen : float
hahigh : float
halow : float
Returns: float
hatrendbext(haclose, haopen, hahigh, halow)
hatrendext: heiken-ashi trend extreme
Parameters:
haclose : float
haopen : float
hahigh : float
halow : float
Returns: float
habclose(smthtype, amafl, amasl, kfl, ksl)
habclose: heiken-ashi better open
Parameters:
smthtype : string
amafl : int
amasl : int
kfl : int
ksl : int
Returns: float
habopen(smthtype, amafl, amasl, kfl, ksl)
habopen: heiken-ashi better open
Parameters:
smthtype : string
amafl : int
amasl : int
kfl : int
ksl : int
Returns: float
habhigh(smthtype, amafl, amasl, kfl, ksl)
habhigh: heiken-ashi better high
Parameters:
smthtype : string
amafl : int
amasl : int
kfl : int
ksl : int
Returns: float
hablow(smthtype, amafl, amasl, kfl, ksl)
hablow: heiken-ashi better low
Parameters:
smthtype : string
amafl : int
amasl : int
kfl : int
ksl : int
Returns: float
habmedian(smthtype, amafl, amasl, kfl, ksl)
habmedian: heiken-ashi better median
Parameters:
smthtype : string
amafl : int
amasl : int
kfl : int
ksl : int
Returns: float
habtypical(smthtype, amafl, amasl, kfl, ksl)
habtypical: heiken-ashi better typical
Parameters:
smthtype : string
amafl : int
amasl : int
kfl : int
ksl : int
Returns: float
habweighted(smthtype, amafl, amasl, kfl, ksl)
habweighted: heiken-ashi better weighted
Parameters:
smthtype : string
amafl : int
amasl : int
kfl : int
ksl : int
Returns: float
habaverage(smthtype, amafl, amasl, kfl, ksl)
habaverage: heiken-ashi better average
Parameters:
smthtype : string
amafl : int
amasl : int
kfl : int
ksl : int
Returns: float
habavemedbody(smthtype, amafl, amasl, kfl, ksl)
habavemedbody: heiken-ashi better median body
Parameters:
smthtype : string
amafl : int
amasl : int
kfl : int
ksl : int
Returns: float
habtrendb(smthtype, amafl, amasl, kfl, ksl)
habtrendb: heiken-ashi better trend
Parameters:
smthtype : string
amafl : int
amasl : int
kfl : int
ksl : int
Returns: float
habtrendbext(smthtype, amafl, amasl, kfl, ksl)
habtrendbext: heiken-ashi better trend extreme
Parameters:
smthtype : string
amafl : int
amasl : int
kfl : int
ksl : int
Returns: float

Heiken Ashi DifferencePort of the Heiken Ashi Diff Indicator from Thinkorswim.
The Heikin Ashi Difference study plots the difference of Close and Open prices as expressed in Heikin Ashi values. It also displays auxiliary plot showing the Simple Moving Average of the difference.
Price Action Doji Harami v0.2 by JustUncleLThis is an updated and final version of this indicator. This version distinguishes between the true Harami and the other Doji candlestick patterns as used with the Heikin Ashi candle charts. These candle patterns indicate a potential trend reversal or pullback.
The patterns identified are:
- Bearish Harami (Red Highlight above Bar):
One to three (default 3) large body Bull (green) candles followed by a small (red)
or no body candle (less than 0.5pip) with wicks top and bottom that are at least 60% of candle.
- Bullish Harami (Green Highlight below Bar):
One to three (default 3) large body Bear (red) candles followed by a small (green)
or no body candle (less than 0.5pip) with wicks top and bottom that are at least 60% of candle.
- Bearish Doji (Fuchsia Highlight above Bar):
One to three (default 3) large body Bull (green) candles followed by a small (green)
with wicks top and bottom that are at least 60% of candle.
- Bullish Doji (Aqua Highlight below Bar):
One to three (default 3) large body Bear (red) candles followed by a small (red)
with wicks top and bottom that are at least 60% of candle.
You can optionally specify how large the candles prior to Harami/Doji are in pips, default is 0 pip.
If you set this to zero then it will have no candle size consideration. You can also specify how many look back candles (1-3) are used in Harami/Doji calculations (default 3).
Included option to perform Calculations purely on Heikin Ashi candles, this helps when you want to see the HA Doji/Harami bars with the normal candle stick chart.
Also can optionally set an alert condition for when Harami/Doji found, this also displays a circle on the bottom of the screen when alert is triggered.

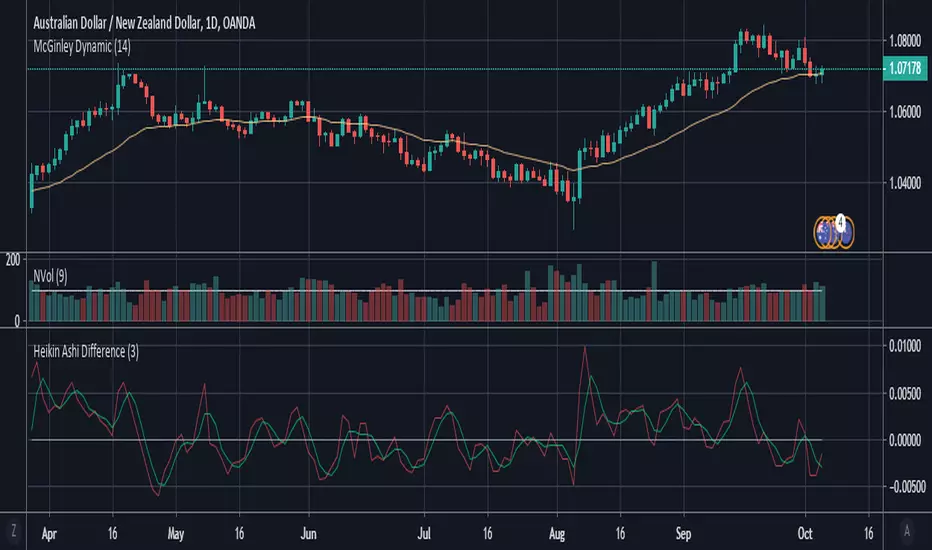
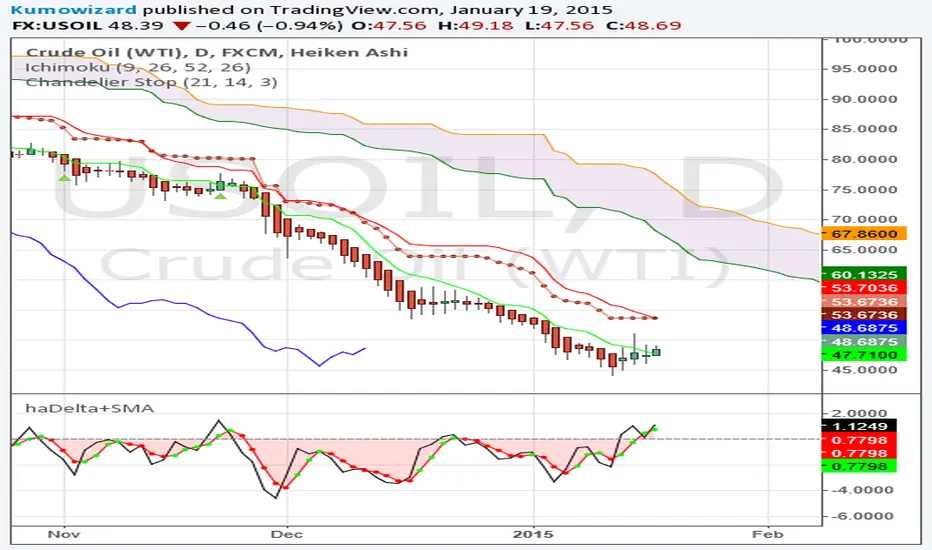
haDelta (developed by Dan Valcu)haDelta is a simple indicator originally developed and published by Mr. Dan Valcu.
The indicator is used quantify Heikin Ashi candles, measures the difference between HA close and HA open.
haDelta is sensitive indicator, measures the height of the candle body, for smoothing a 3 period SMA is used (similar to Qstick indicator).
The crossovers of haDelta and SMA(3) can give important early signals and confirmation together with Heiken Ashi candle patterns about possible trend reversals or trend exhaustion.
The zero line is also very important. Whenever haDelta and/or its SMA(3) crosses over the zero line, it gives further signal of possible strength of the trend.
Please note that haDelta is not for mechanic trading alone, but for use in conjunction with Heikin Ashi rules.
Vervoort Heiken-Ashi LongTerm Candlestick Oscillator [LazyBear]HACOLT (Heikin Ashi Candles Oscillator Long Term) is a technical indicator designed by Sylvain Vervoort. It is based on Mr.Vervoort's other indicator, HACO (Heikin-Ashi Candles Oscillator - posted here: ).
Optimized for long-term trading, HACOLT shows three levels: -1, 0 and 1. These levels suggest "an open short position", "no open position", and "an open long position", respectively. Passing from a certain level to another is viewed as a trading signal:
- Rising from -1 or 0 to 1 suggests a Long Entry and Short exit;
- Falling from 1 to 0 or -1 suggests a Long Exit;
- Falling from 1 or 0 to -1 indicates a Short Entry.
Fits in nicely with any trading setup as a confirmation indicator
More info:
- tlc.thinkorswim.com
- www.motivewave.com
List of my other indicators:
- GDoc: docs.google.com
- Chart:

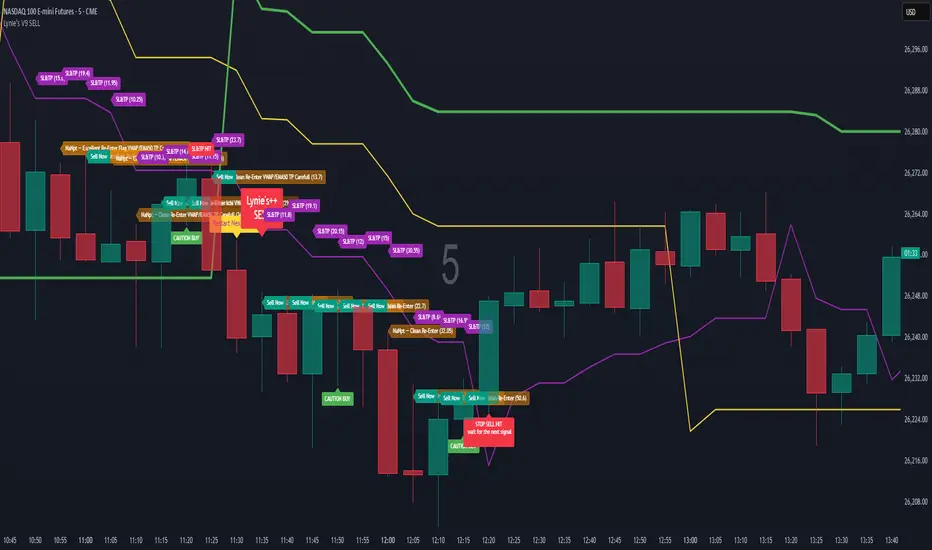
Lynie's V9 SELL🟢🔴 Lynie’s V8 — BUY & SELL (Mirrored, Interlocking System)
Lynie’s V8 is a paired long/short engine built as two mirrored scripts—Lynie’s V8 BUY and Lynie’s V8 SELL—that read price the same way, flip conditions symmetrically, and manage trades with the exact logic on opposite sides. Use either one standalone or run both together for full two-sided automation of entries, re-entries, caution states, and adaptive SL/TP.
✳️ What “mirrored” means here
Supertrend Tri-Stack (10/11/12):
BUY: ST10 primary pierce; ST12 fallback; “PAG Buy” when price pierces any ST while above the other two.
SELL: Exact inverse—ST10 primary pierce down; ST12 fallback; “PAG Sell” when price pierces any ST while below the other two.
Re-Enter Clusters:
BUY: Ratcheted up (Heikin-Ashi green holds/tightens).
SELL: Ratcheted down (Heikin-Ashi red holds/tightens).
Both sides use the same cluster age/decay math, care penalties, session awareness, and fast-candle tightening.
Care Flags (context risk):
Ichimoku, MACD, RSI combine into single and paired flags that tighten or widen offsets on both sides with the same scoring.
VWAP–EMA50 (5m) cluster gate:
Identical distance checks for BUY/SELL. When the mean cluster is present, offsets and labels adapt (tighter/“riskier scalp” messaging).
Golden Pocket A/B/C (prev-day):
Same fib boxes & labeling (gold tone) on both sides to call out TP-friendly zones.
SL/TP Envelope:
Shared dynamic engine: per-bar decay, fast-candle expansion, and care-based compress/relax—all mirrored for up/down.
Caution Labels:
BUY side prints CAUTION SELL if HA flips red inside an active long cluster.
SELL side prints CAUTION BUY if HA flips green inside an active short cluster.
Same latching & auto-release behavior.
🧠 Core workflow (both sides)
Primary trigger via ST10 pierce (structure shift) with an ST12 fallback when ST10 didn’t qualify.
PAG Mode when price is already on the right side of the other two STs—strongest conviction.
Cluster phase begins after a signal: ratcheted re-entry level, session-aware offsets, dynamic tightening on fast bars.
Care system shapes every re-entry & SL/TP label (Ichi/MACD/RSI combos + VWAP/EMA gate + QQE).
Protective layer: SL-wick and SL-body logic, caution flips, and “hold 1 bar” cluster carry after SL to avoid whipsaw spam.
🔎 Labels & messages (shared vocabulary)
Lynie’s / Lynie’s+ / Lynie’s++ — strength tiers (ST12 involvement & clean context).
Re-Enter / Excellent Re-Enter — cluster pullback quality; ratchet shows the “must-hold” zone.
SL&TP (n) — live offset multiplier the engine is using right now.
CAUTION BUY / CAUTION SELL — HA flip against the active side inside the cluster.
Restart Next Candle — visual cue to re-arm after a confirmed signal bar.
⚡ Why run both together
Continuity: When a long cycle ends (SL or caution degradation), the SELL engine is already tracking the inverse without re-tuning.
Symmetry: Same math, same signals, opposite direction—no hidden biases.
Coverage: Trend hand-offs are cleaner; you don’t miss early shorts after a long fade (and vice versa).
🔧 Recommended usage
Intraday futures (ES/NQ) or any liquid market.
Keep the VWAP–EMA cluster ON; it filters FOMO chases.
Honor Caution flips inside cluster—scale down or wait for the next clean re-enter.
Treat Golden Zones as TP magnets, not guaranteed reversals.
📌 Notes
Both scripts are Pine v6 and independent. Load BUY and SELL together for the full experience.
All offsets (re-enter & SL/TP) are visible in labels—so you always know why a zone is where it is.
Alerts are provided for signals, re-enter hits, caution, and SL events on both sides.
Summary: Lynie’s V8 BUY & SELL are vice-versa twins—one framework, two directions—delivering consistent entries, adaptive re-entries, and contextual risk management whether the market is pressing up or breaking down.
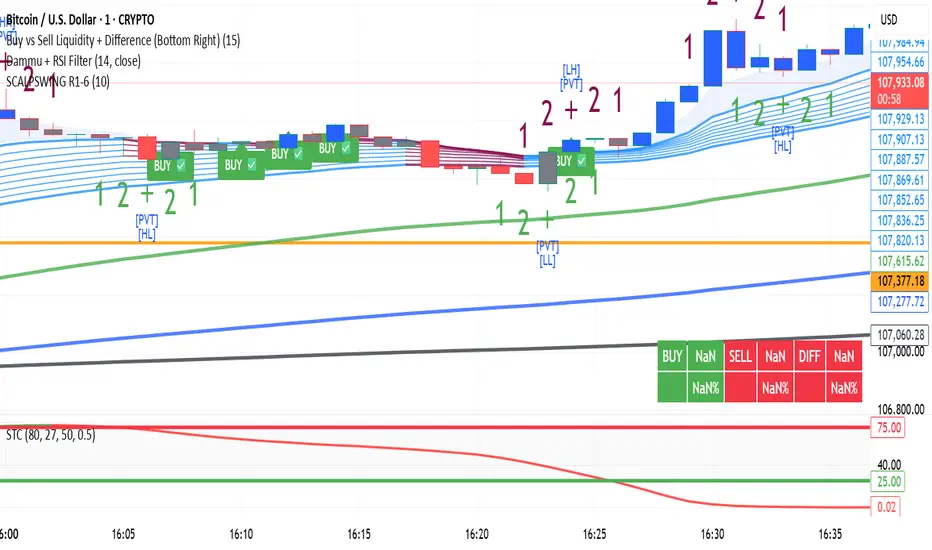
DAMMU SWING TRADING PROScalping and swing trading tool for 15-min and 1-min charts.
Designed for trend, pullback, and reversal analysis.
Works optionally with Heikin Ashi candles.
Indicators Used
EMAs:
EMA89/EMA75 (green)
EMA200/EMA180 (blue)
EMA633/EMA540 (black)
EMA5-12 channel & EMA12-36 ribbon for short-term trends
Price Action Channel (PAC) – EMA high/low/close, length adjustable
Fractals & Pristine Fractals (BW filter)
Higher High (HH), Lower High (LH), Higher Low (HL), Lower Low (LL) detection
Pivot Points – optional, disables fractals automatically
Bar color coding based on PAC:
Blue → Close above PAC
Red → Close below PAC
Gray → Close inside PAC
Trading Signals
PAC swing alerts: arrows or shapes when price exits PAC with optional 200 EMA filter.
RSI 14 signals (if added):
≥50 → BUY
<50 → SELL
Chart Setup
Two panes: 15-min (trend anchor) + 1-min (entry)
Optional Heikin Ashi candles
Use Sweetspot Gold2 for support/resistance “00” and “0” lines
Trendlines can be drawn using HH/LL or Pivot points
Usage Notes
Trade long only if price above EMA200; short only if below EMA200
Pullback into EMA channels/ribbons signals potential continuation
Fractals or pivot points help define trend reversals
PAC + EMA36 used for strong momentum confirmation
Alerts
Up/Down PAC exit alerts configurable with big arrows or labels
RSI labels show buy/sell zones (optional)
Works on both 15-min and 1-min timeframes
If you want, I can make an even shorter “super cheat-sheet” version for 1-page quick reference for trading. It will list only inputs, signals, and colors.

DAMMU Swing Trading PRODammu Scalping Pro – Short Notes
1️⃣ Purpose:
Scalping and swing trading tool for 15-min and 1-min charts.
Designed for trend continuation, pullbacks, and reversals.
Works well with Heikin Ashi candles (optional).
2️⃣ Core Components:
EMAs:
Fast: EMA5-12
Medium: EMA12-36 Ribbon
Long: EMA75/89 (1-min), EMA180/200 (15-min), EMA540/633
Price Action Channel (PAC): EMA-based High, Low, Close channel.
Fractals: Regular & filtered (BW) fractals for swing recognition.
Higher Highs / Lower Highs / Higher Lows / Lower Lows (HH, LH, HL, LL).
Pivot Points: Optional display with labels.
3️⃣ Bar Coloring:
Blue: Close above PAC
Red: Close below PAC
Gray: Close inside PAC
4️⃣ Alerts:
Swing Buy/Sell arrows based on PAC breakout and EMA200 filter.
Optional “Big Arrows” mode for visibility.
Alert messages: "SWING_UP" and "SWING_DN"
5️⃣ Workflow / Usage Tips:
Set chart to 15-min (for trend) + 1-min (for entry).
Optionally enable Heikin Ashi candles.
Trade long only above EMA200, short only below EMA200.
Watch for pullbacks into EMA channels or ribbons.
Confirm trend resumption via PAC breakout & bar color change.
Use fractals and pivot points to draw trendlines and locate support/resistance.
6️⃣ Optional Filters:
Filter PAC signals with 200 EMA.
Filter fractals for “Pristine/Ideal” patterns (BW filter).
7️⃣ Visuals:
EMA ribbons, PAC fill, HH/LL squares, fractal triangles.
Pivot labels & candle numbering for patterns.
8️⃣ Notes:
No extra indicators needed except optionally SweetSpot Gold2 for major S/R levels.
Suitable for scalping pullbacks with trend confirmation.
If you want, I can make an even shorter “one-screen cheat sheet” with colors, alerts, and EMAs, perfect for real-time chart reference.
Do you want me to do that?

DAMMU Swing Trading PRODammu Scalping Pro – Short Notes
1️⃣ Purpose:
Scalping and swing trading tool for 15-min and 1-min charts.
Designed for trend continuation, pullbacks, and reversals.
Works well with Heikin Ashi candles (optional).
2️⃣ Core Components:
EMAs:
Fast: EMA5-12
Medium: EMA12-36 Ribbon
Long: EMA75/89 (1-min), EMA180/200 (15-min), EMA540/633
Price Action Channel (PAC): EMA-based High, Low, Close channel.
Fractals: Regular & filtered (BW) fractals for swing recognition.
Higher Highs / Lower Highs / Higher Lows / Lower Lows (HH, LH, HL, LL).
Pivot Points: Optional display with labels.
3️⃣ Bar Coloring:
Blue: Close above PAC
Red: Close below PAC
Gray: Close inside PAC
4️⃣ Alerts:
Swing Buy/Sell arrows based on PAC breakout and EMA200 filter.
Optional “Big Arrows” mode for visibility.
Alert messages: "SWING_UP" and "SWING_DN"
5️⃣ Workflow / Usage Tips:
Set chart to 15-min (for trend) + 1-min (for entry).
Optionally enable Heikin Ashi candles.
Trade long only above EMA200, short only below EMA200.
Watch for pullbacks into EMA channels or ribbons.
Confirm trend resumption via PAC breakout & bar color change.
Use fractals and pivot points to draw trendlines and locate support/resistance.
6️⃣ Optional Filters:
Filter PAC signals with 200 EMA.
Filter fractals for “Pristine/Ideal” patterns (BW filter).
7️⃣ Visuals:
EMA ribbons, PAC fill, HH/LL squares, fractal triangles.
Pivot labels & candle numbering for patterns.
8️⃣ Notes:
No extra indicators needed except optionally SweetSpot Gold2 for major S/R levels.
Suitable for scalping pullbacks with trend confirmation.
If you want, I can make an even shorter “one-screen cheat sheet” with colors, alerts, and EMAs, perfect for real-time charT